Well that was a week of weather! I first mentioned Alfred nearly 3 weeks ago! The EC forecast from a long way out pretty much nailed the pathway that Alfred took:
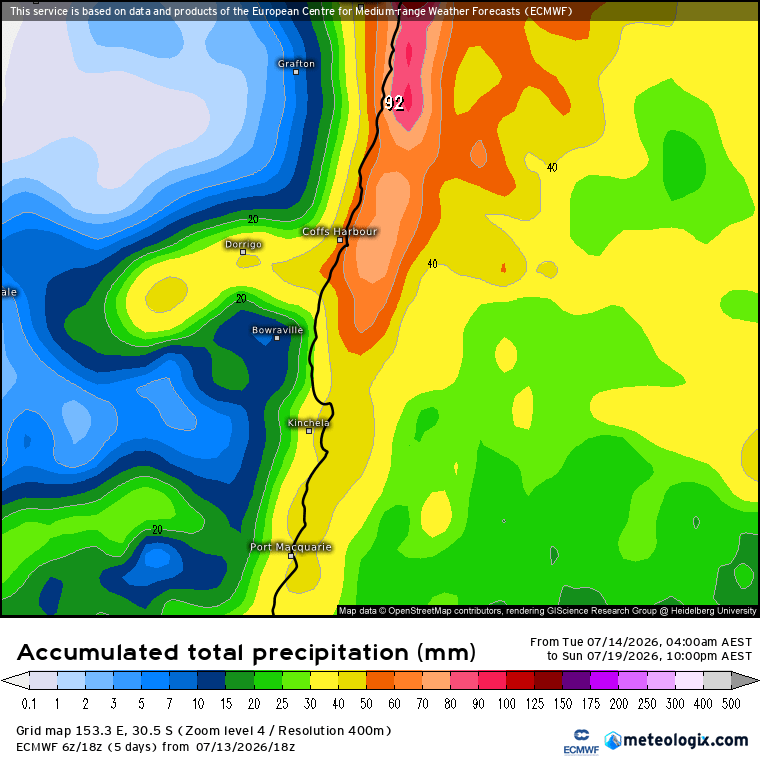
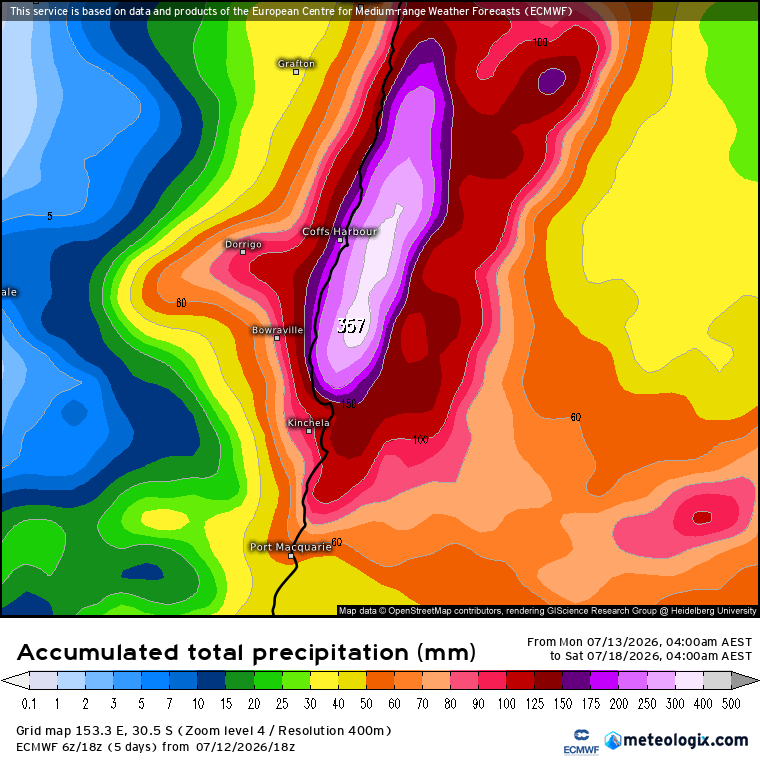
Models were predicting some big rain totals with this event:
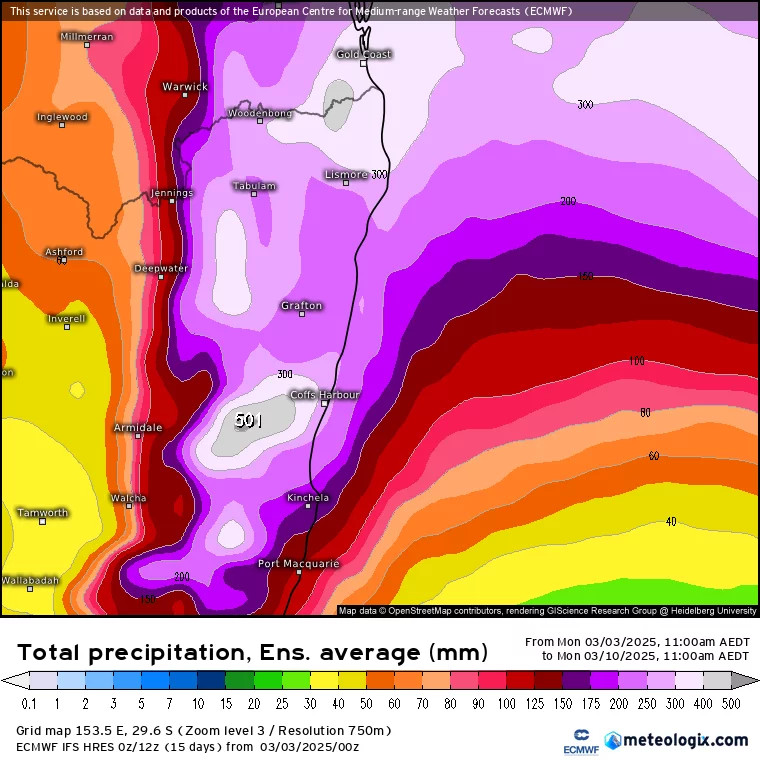
….and that’s pretty much what we saw:
The BoM radars can be used to (roughly) calculate how much fell – here’s how much the Grafton radar shows:
…and the Brisbane radar gives these totals:
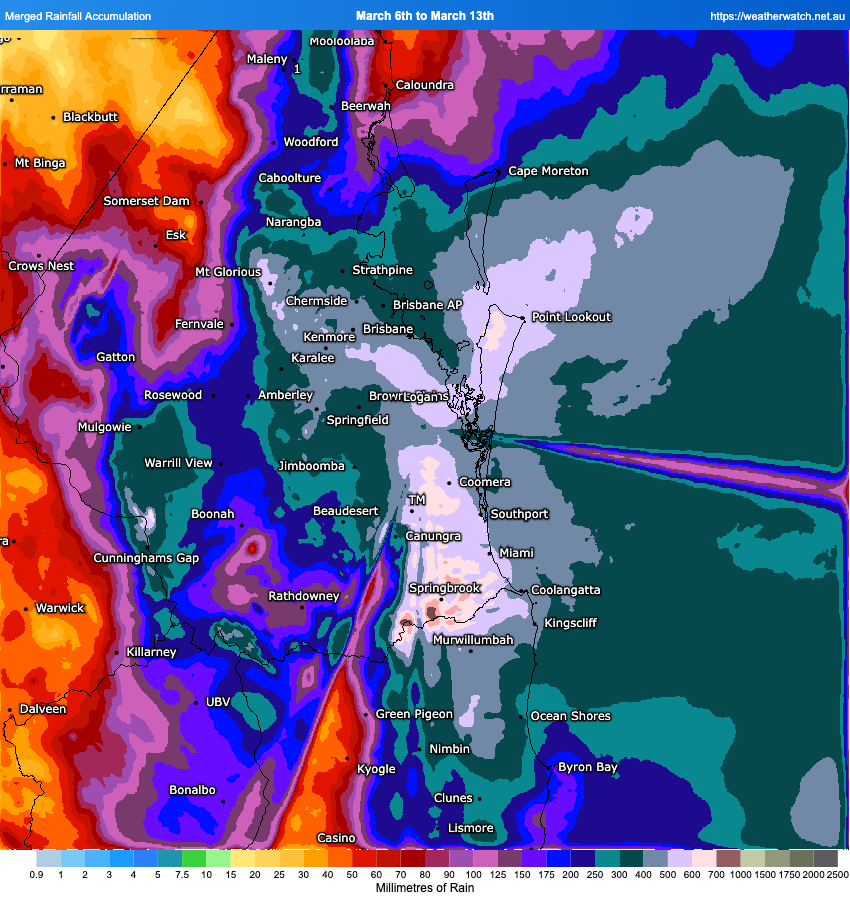
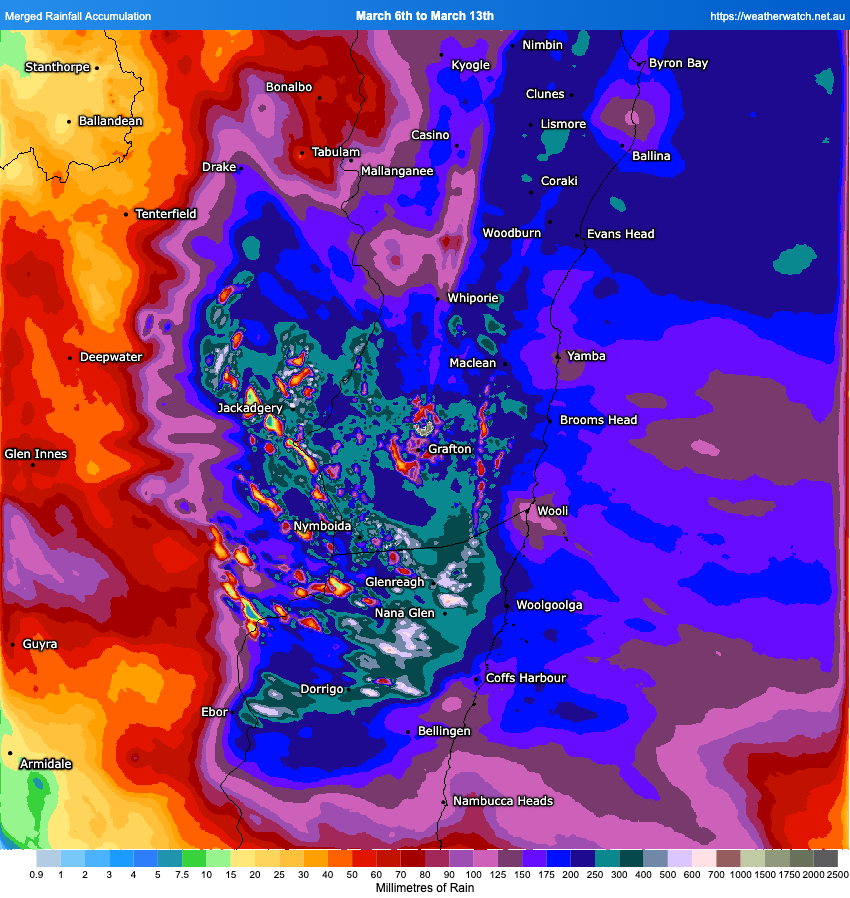
For our region you can see the real focus on the hills with the focus closer to the coast in SE Qld – pretty much exactly where the models forecast the higher totals to be. Recorded totals across our region include:
Deervale 1066mm (thanks to the RFS weather station for this total)
Meldrum 742mm
Lowanna 740mm
Point Lookout 641mm
Upper Darkwood 498mm
Promised Land 466mm
Kalang (Kooroowi) 420mm
Spicketts Creek 495mm
The rain was limited in it’s western extent – you only have to go as far as Armidale to see only 42mm for the week. Needless to say the Bellinger and other local rivers came up pretty quickly:
Enough of things gone past…Looking ahead and the waters off our coast cooled down considerably with the cyclone moving through, however the East Australia Current is already pumping some warmer water back south:
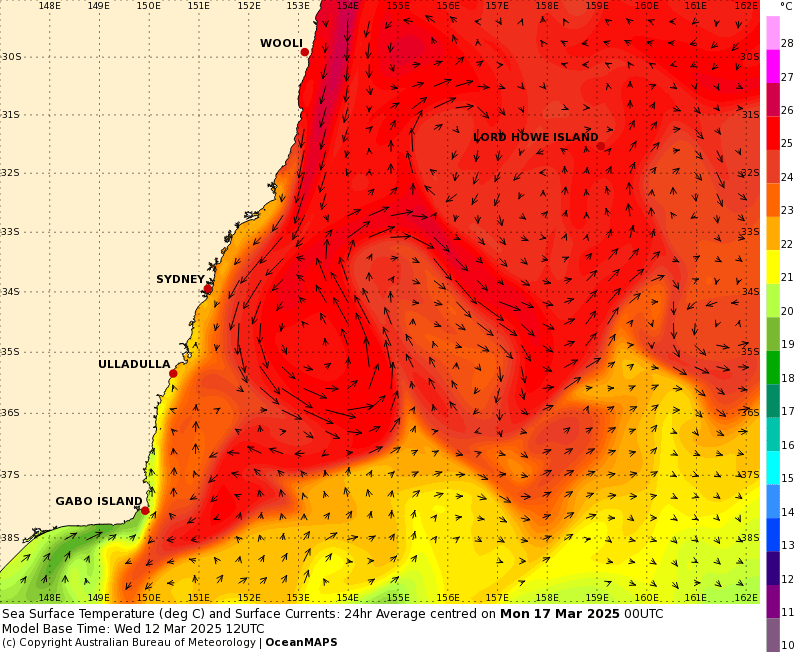
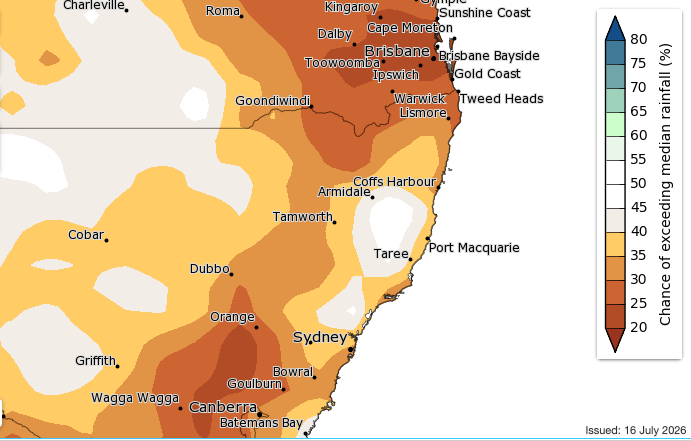
….so we’ll likely see some more humid weather whenever we get onshore winds. The good news is that models are not showing any big rain totals over the coming week, with sun at times – and some hotter weather into this weekend before a cooler change moves through. The following week shows some tropical air trying to move south across eastern Australia but right now no models show big totals for us…I’ll keep an eye on things in case that changes over time.
Looking further ahead and the monthly models are now out for March and show average rainfall is likely over the winter / spring before potentially getting a little wetter again as we head into summer:
It’s worth flagging that late winter and spring are usually drier times…and some of the models runs indicate even drier than average across that time. With recent rains and strong growth in the bush I’ll keep an eye on the forecasts through winter as we head into our traditional fire season.
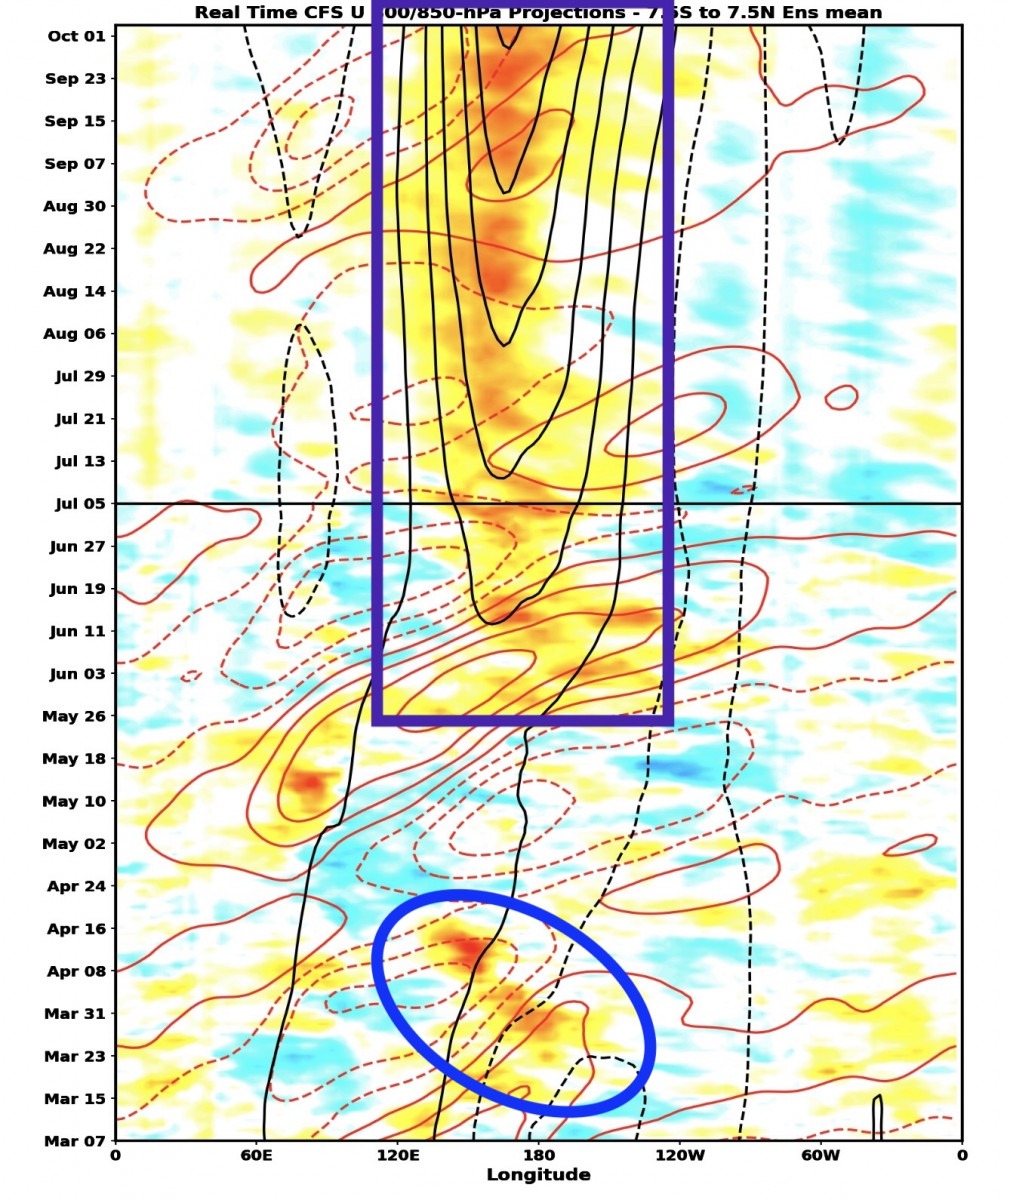
The reason for the closer-to-average forecast? The current La Nina (or what is left of it) is forecast to fade away and be replaced by neutral conditions – and you can see this happening across the Pacific in this latest forecast sea temperature anomaly forecast through to the end of the year:
What also stands out from that forecast – the warmer than average conditions across most oceans around the world. You can also see the warmer air conditions likely through this year – in particular how much warmer than average the northern hemisphere is likely to be:
Needless to say as a result of those warmer air / ocean temperatures we’ll be looking at higher than average day and night temperatures through the year. There will always be warmer and colder spells as week to week weather patterns move through, but overall the warmer conditions will likely win out. With much warmer than average ocean temperatures likely close to our coast we’ll continue to see higher than average humidity levels when winds are onshore.
Thanks to the usual legends for their images – Tropical Tidbits / WeatherWatch Metcentre / BoM. Animations by Bellingen Weather / ezgif.
…and thanks to Snapfrozen for web hosting, Valley Tree Services for keeping the floodcam view clear, Bellingen Council for the floodcam images from across our Shire and Kombu Wholefoods for the streaming cam and site sponsorship 🙂