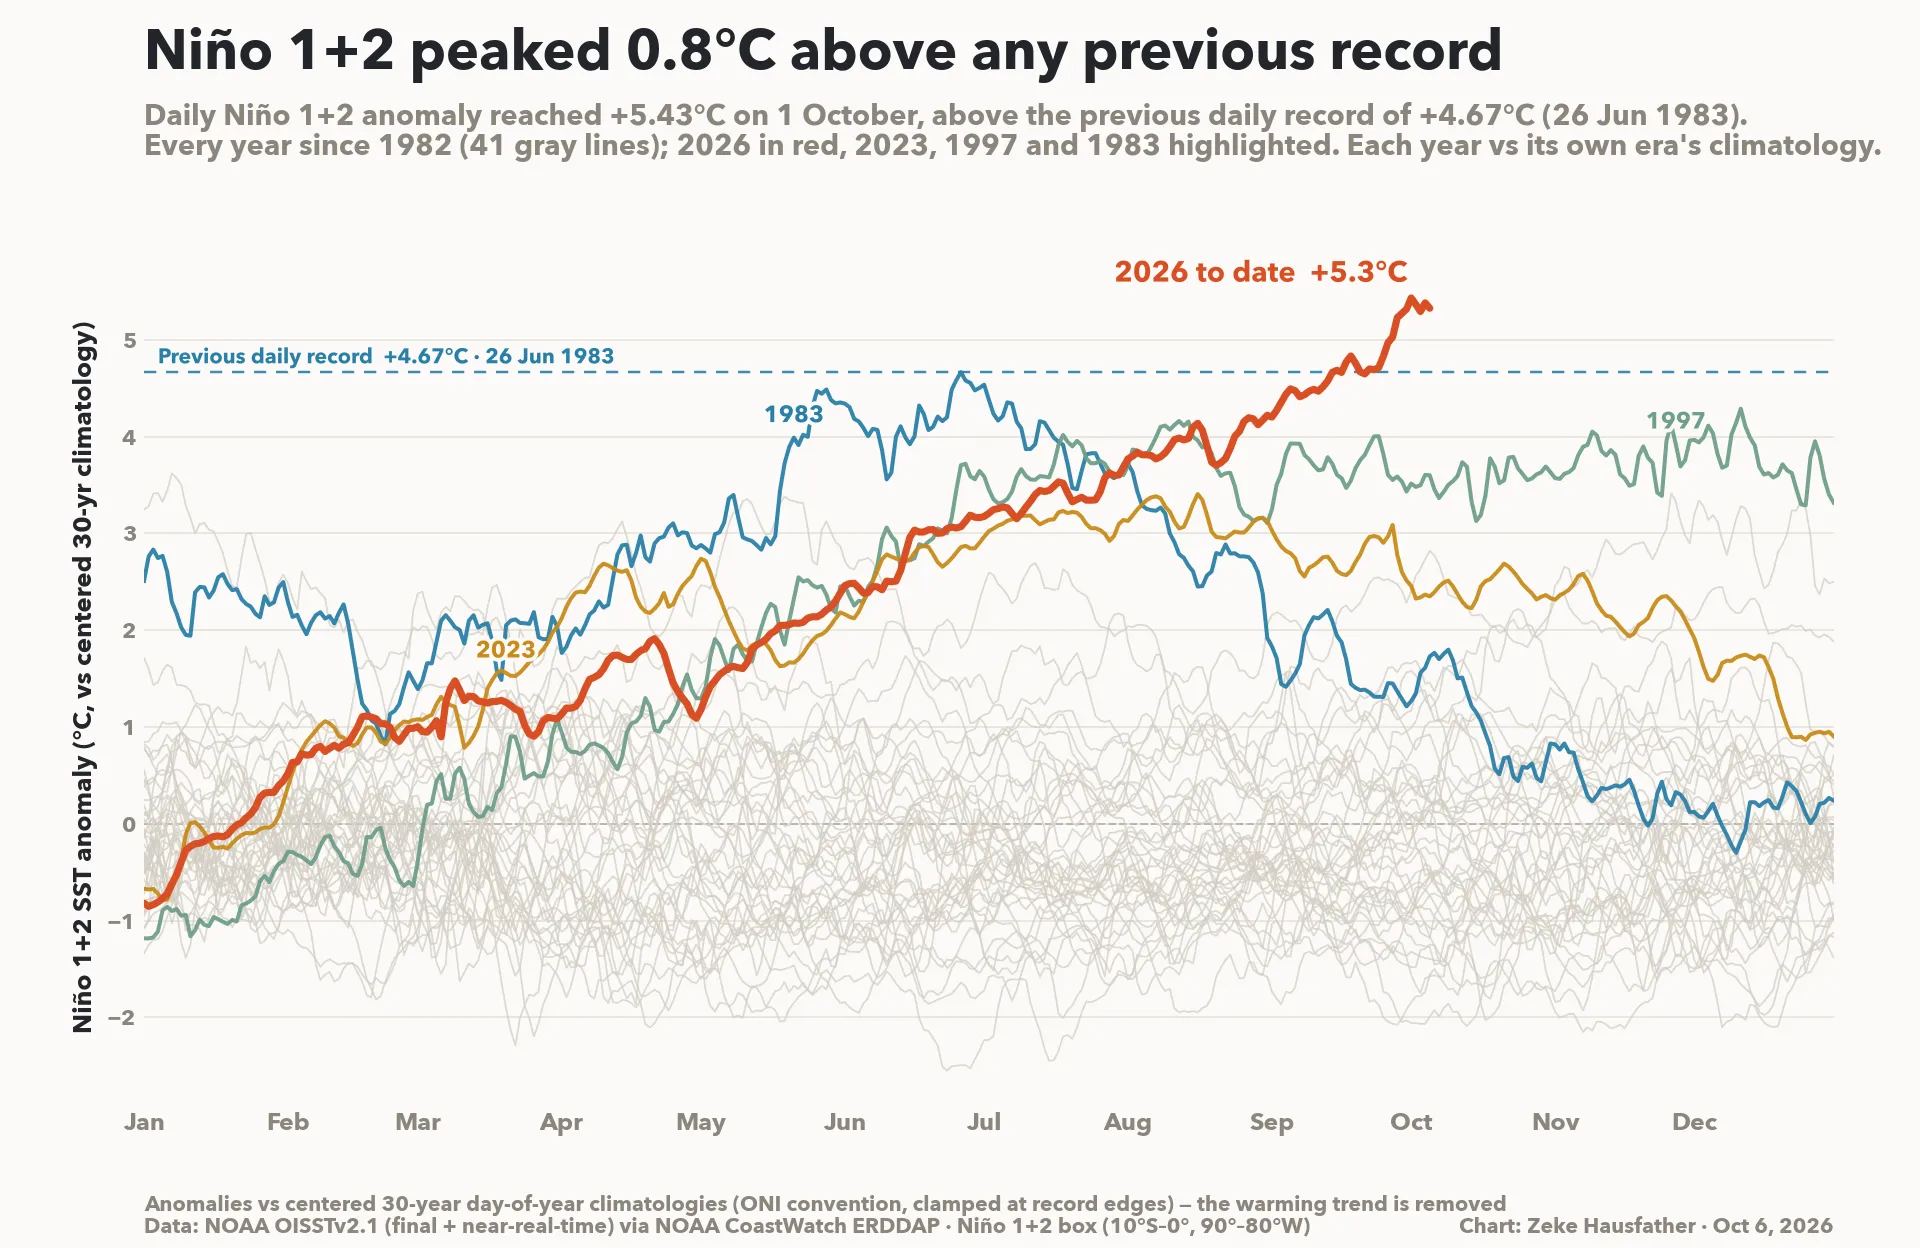
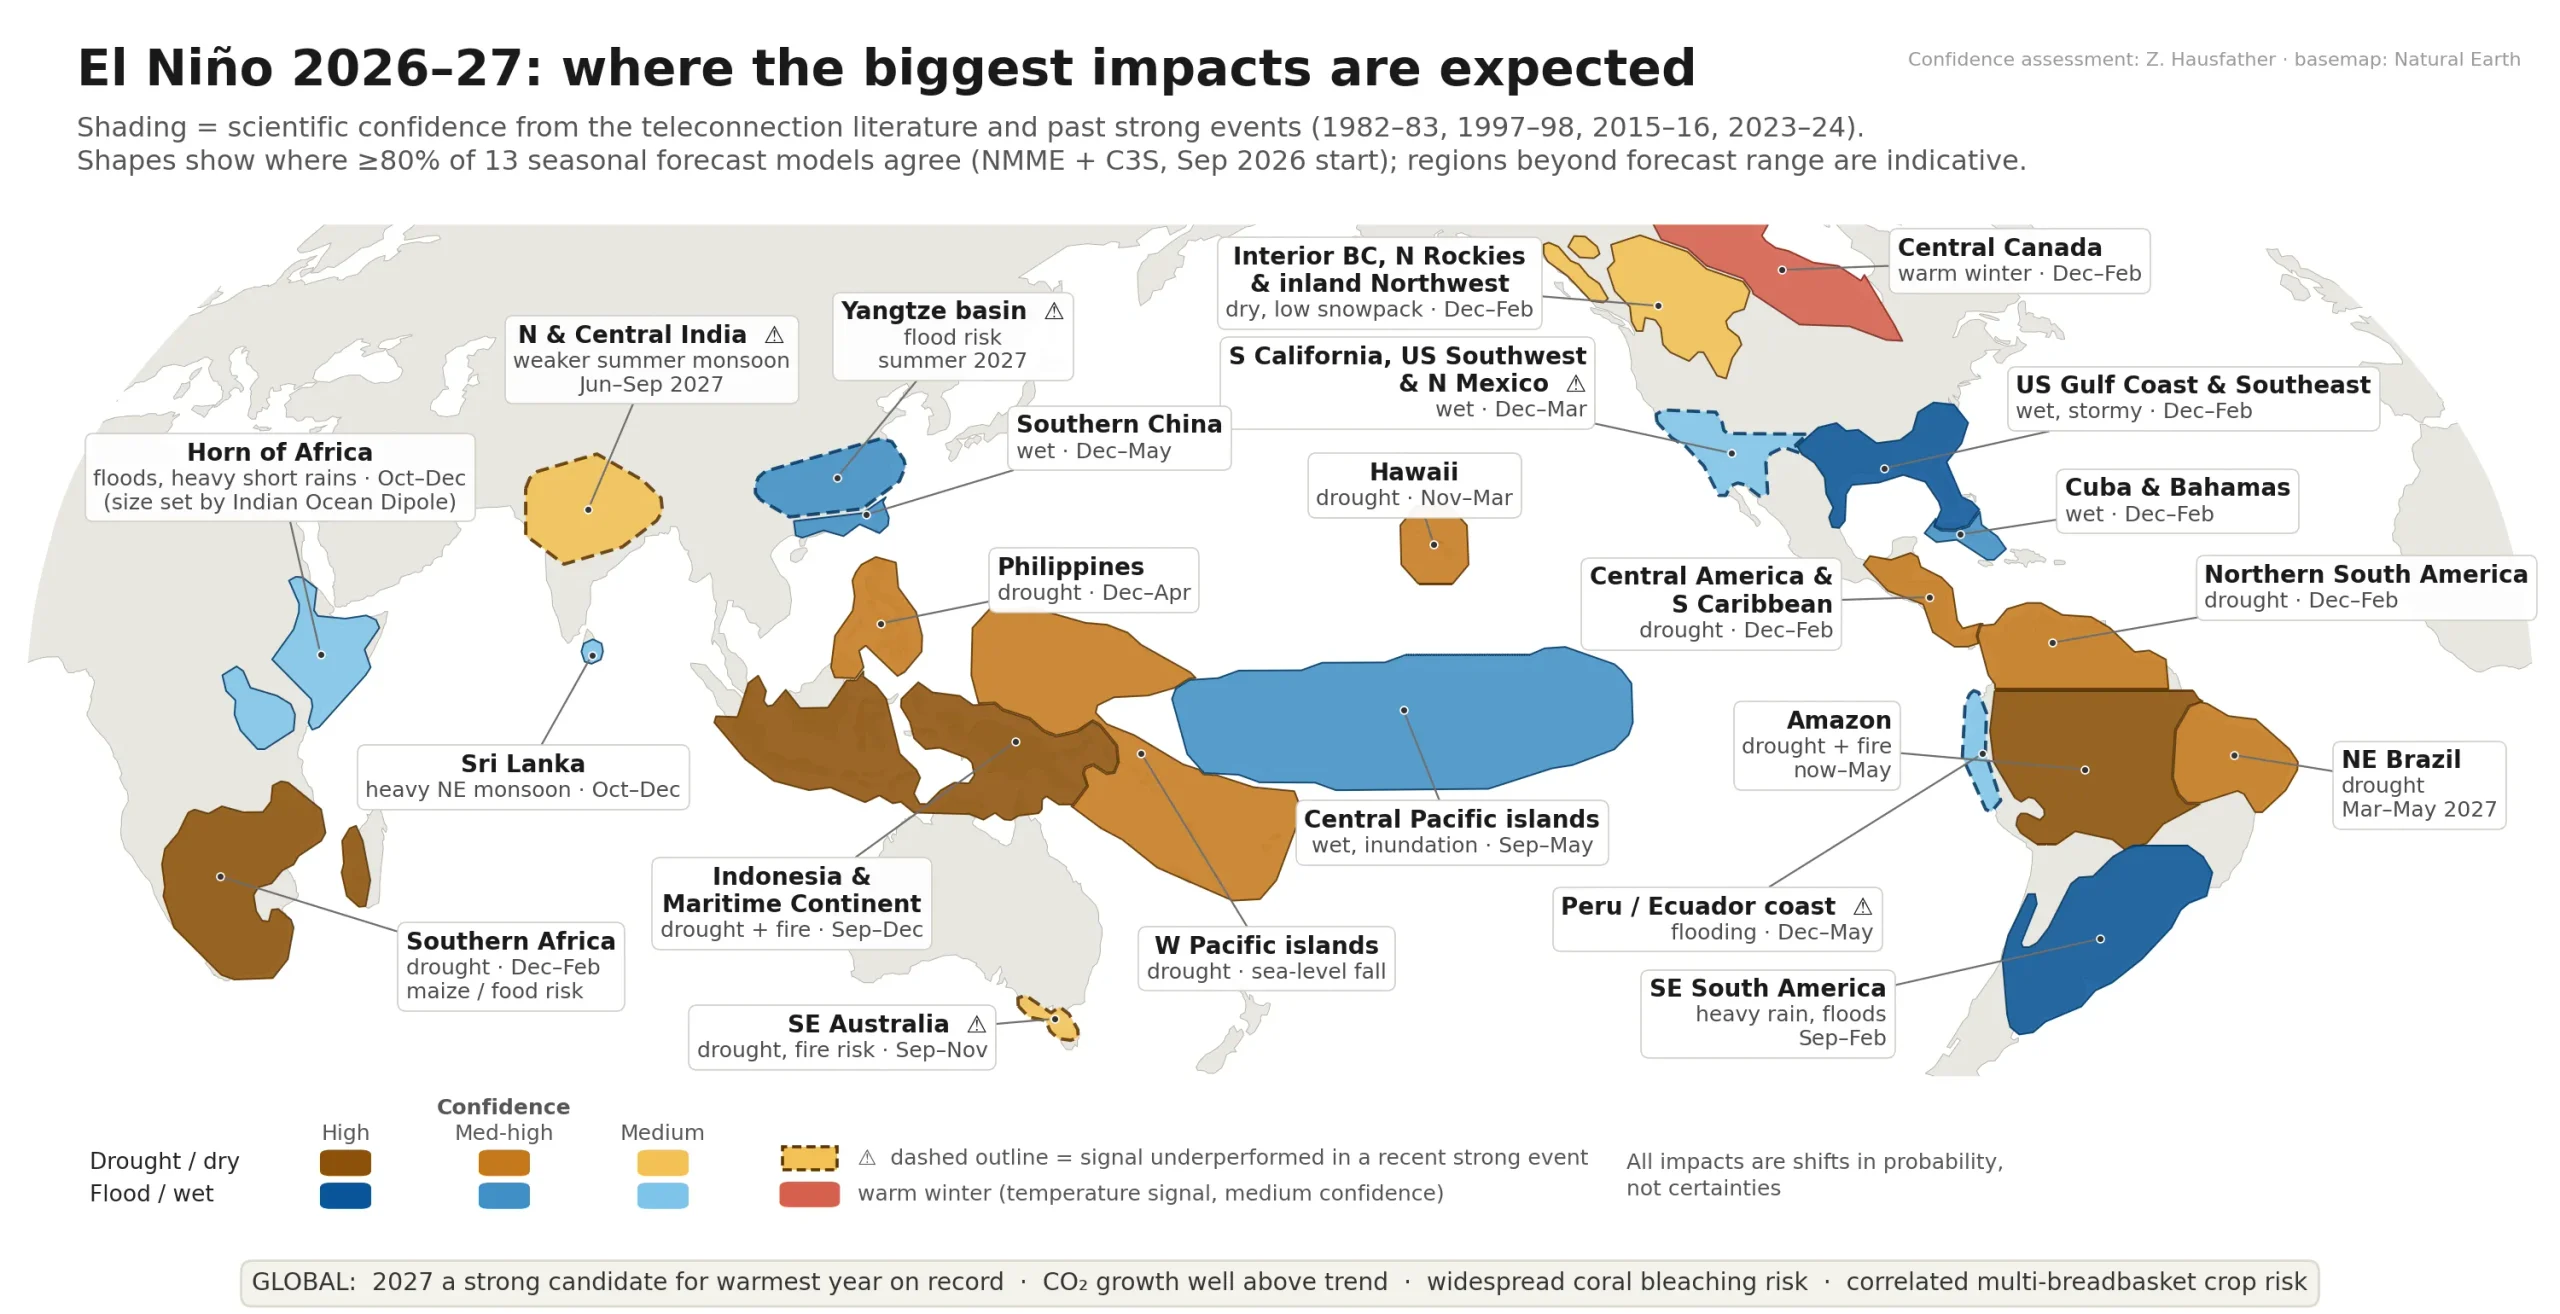
A Bello Weather headline reading like a newspaper headline – but we really are actually in the middle of the wettest El Nino on record. The ABC recently had a great article about this – you can read it here or catch up on the video below:
To be honest it looks like climate change in action / real time – this El Nino is certainly based in the far east (which can have less influence than events based further west) but regardless helped NE NSW / SE QLD with one of the driest early spring periods on record….but warm oceans mean more water in the environment and thus the potential for wetter weather when other conditions align.
And talking of alignment – we’ve currently got onshore winds pushing some deep moisture onto the coast. Those surface winds will last through to the end of the week, and on top of that we have an upper low moving in. Upper lows bring colder air up high and more instability. Again this upper feature will last through until the end of the week – and we can see it easily in this upper air animation:
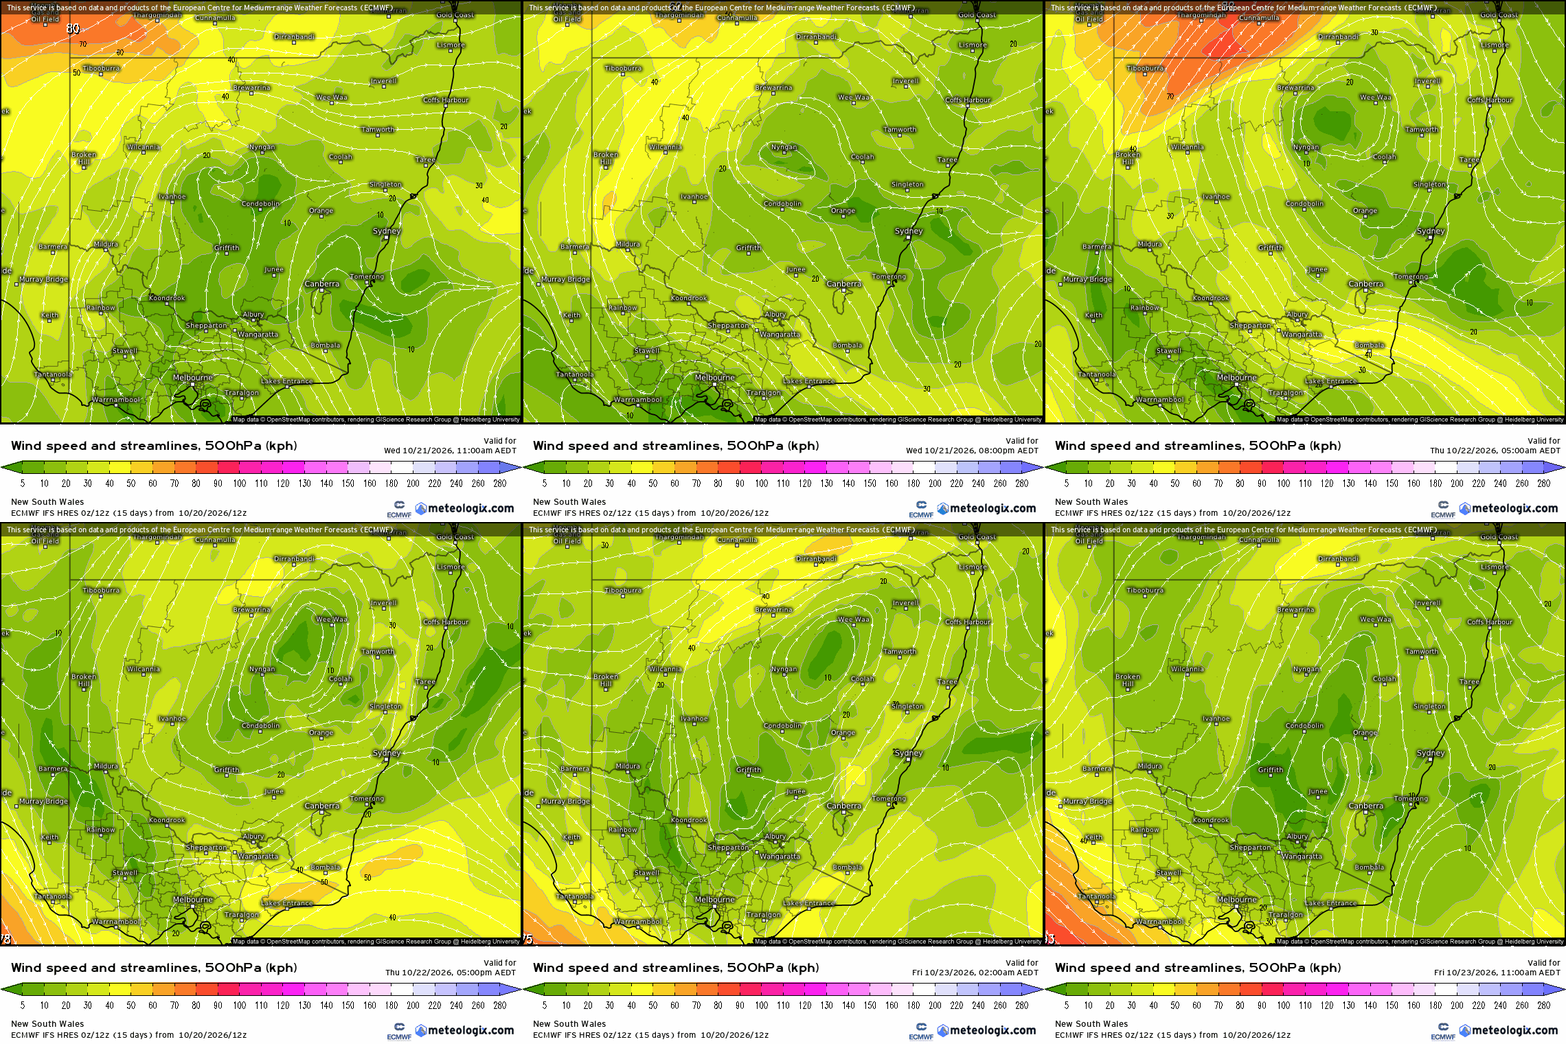
All that instability means showers with the chance of some longer periods of rain….and some locations could well see some decent totals. Here’s the accumulating rain totals for the same period as above:
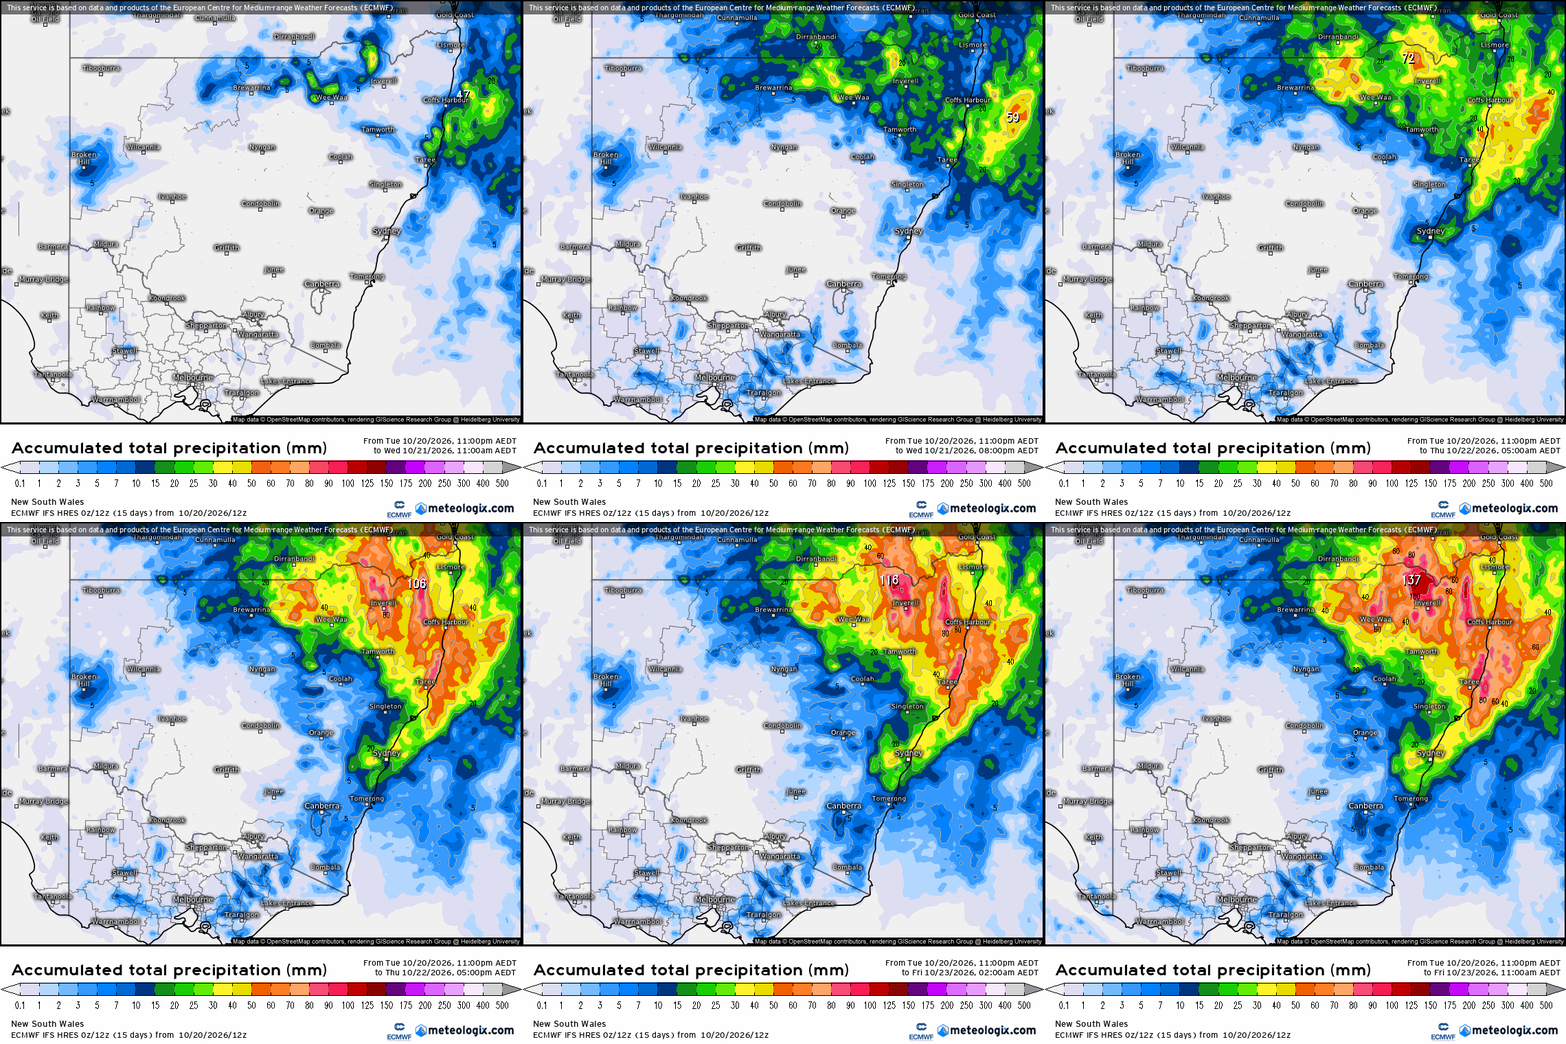
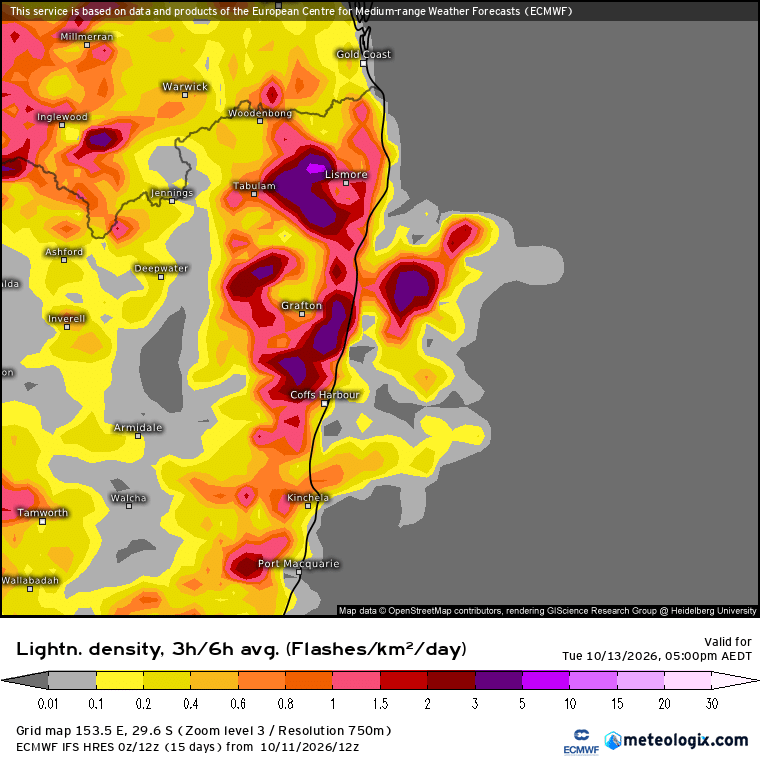
Decent falls likely across large parts of NE NSW – but as is usually the case some locations will see higher totals while others miss out and see lower amounts. There will even be some storms around for some locations, particularly inland – here’s the lightning forecast through to 11am Friday to give you some idea:
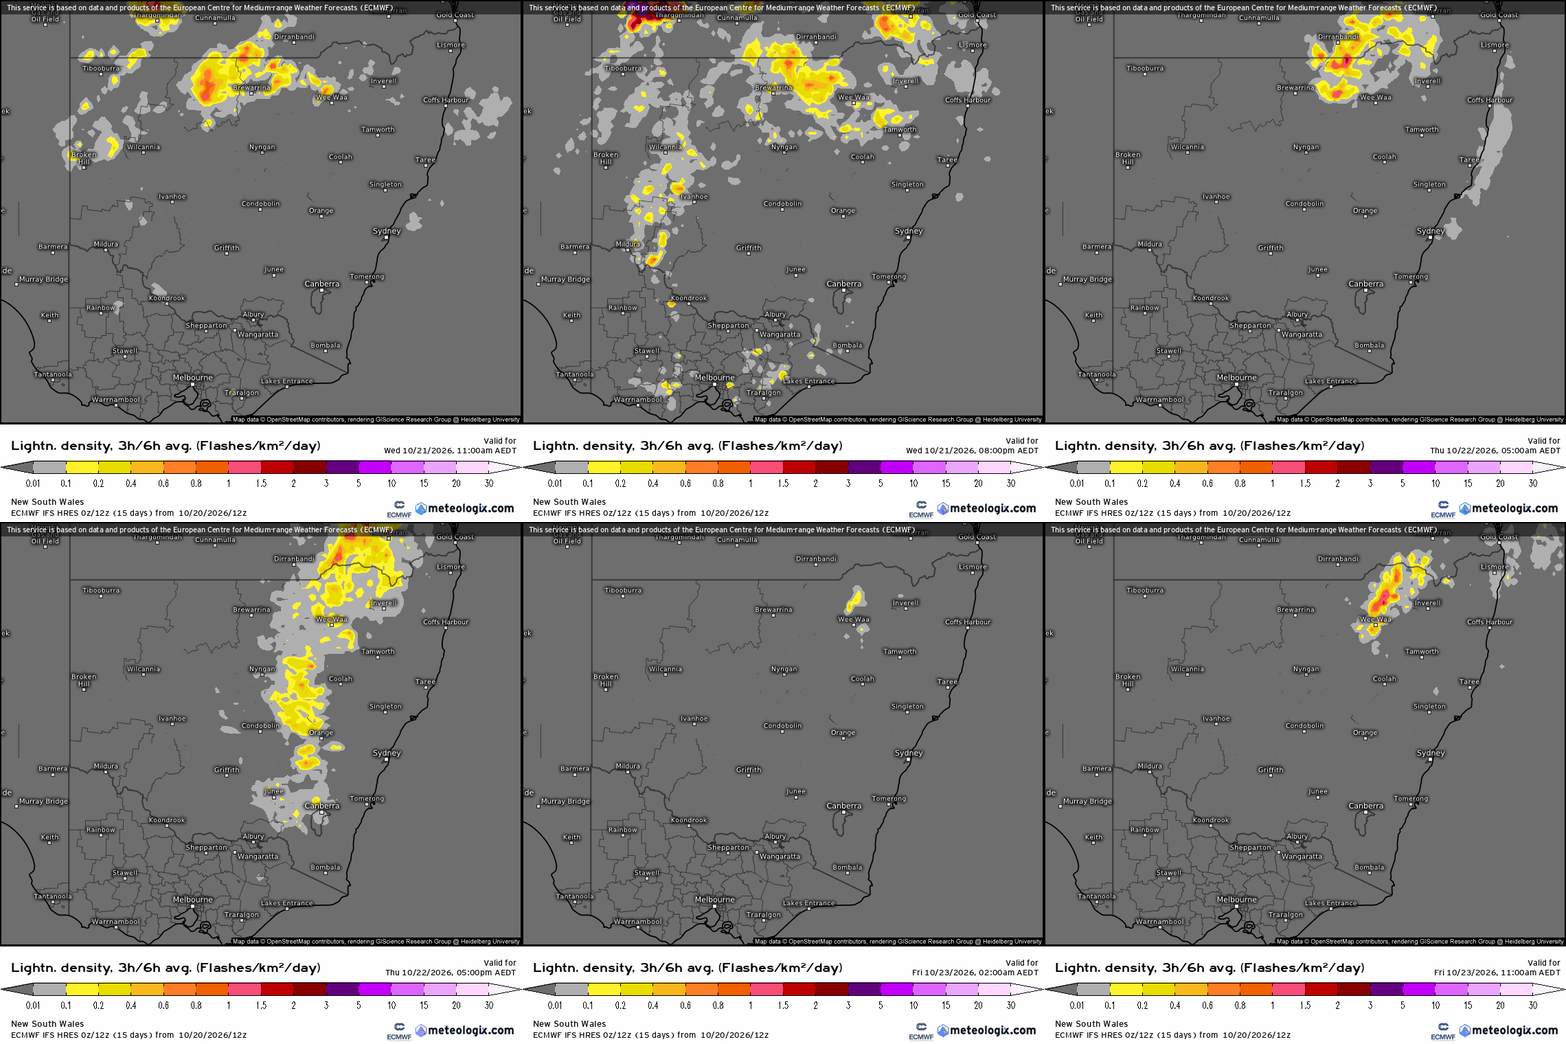
So a busy few days coming up – worth keeping an eye on the radar, particularly afternoons…Whilst widespread riverine flooding is not likely there is the risk of flash flooding with any heavier showers and storms if they remain in the same area for a period of time. The biggest risk for us is likely to be the Waterfall Way cutting where significant rain can increase the risk of short-term closure, however worth keeping an eye on other flashy local creeks / rivers such as the Never Never should we see heavier storms move across. Latest live river heights can be viewed here.
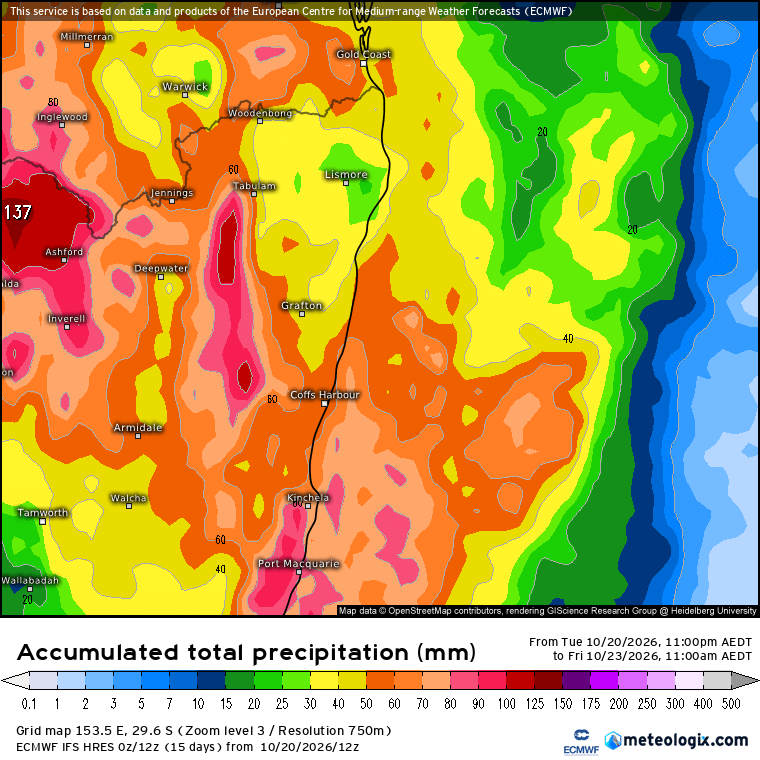
A more detailed rain accumulation chart for our region gives us an average of around 50mm to 60mm over the next 48 hours – but again the emphasis that you could see significantly more – or less:
Going out to 10 days and the rainfall totals show even higher totals:
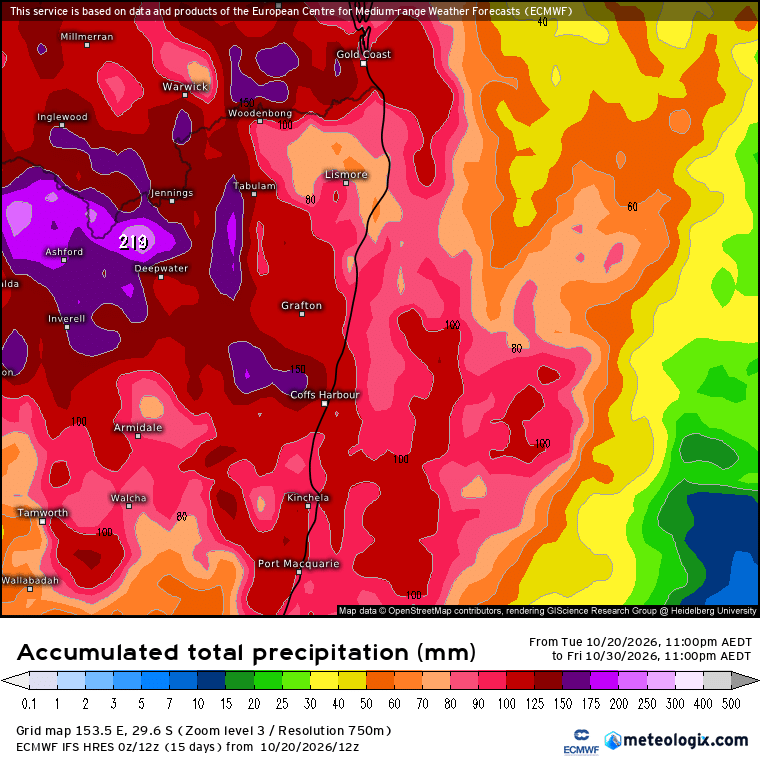
…so expect more to come.
A quick look at the bigger picture and we’ve got off-the-chart temperatures in the tropical Pacific thanks to the record El Nino:
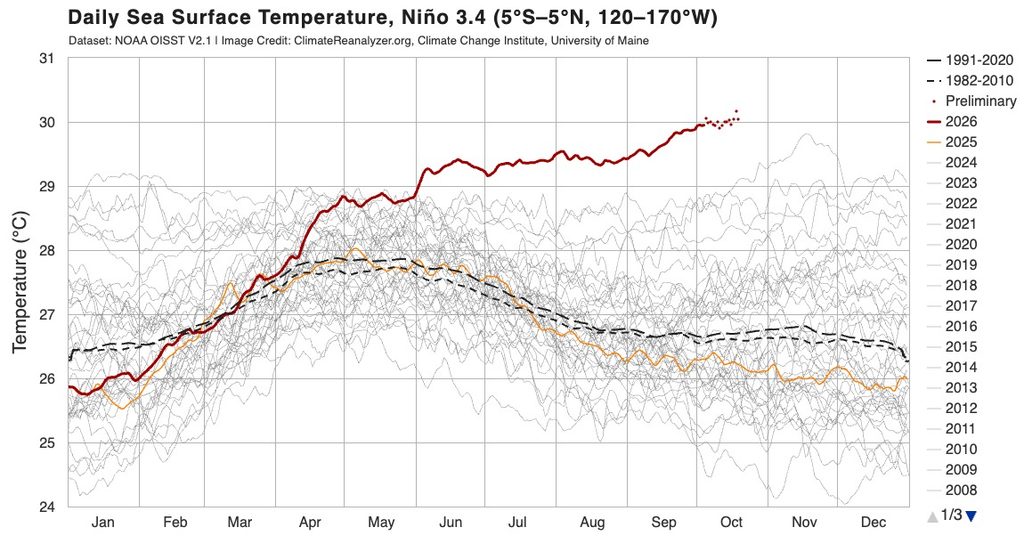
….and those record tropical temps are enough to also take average global ocean temperatures to record levels:
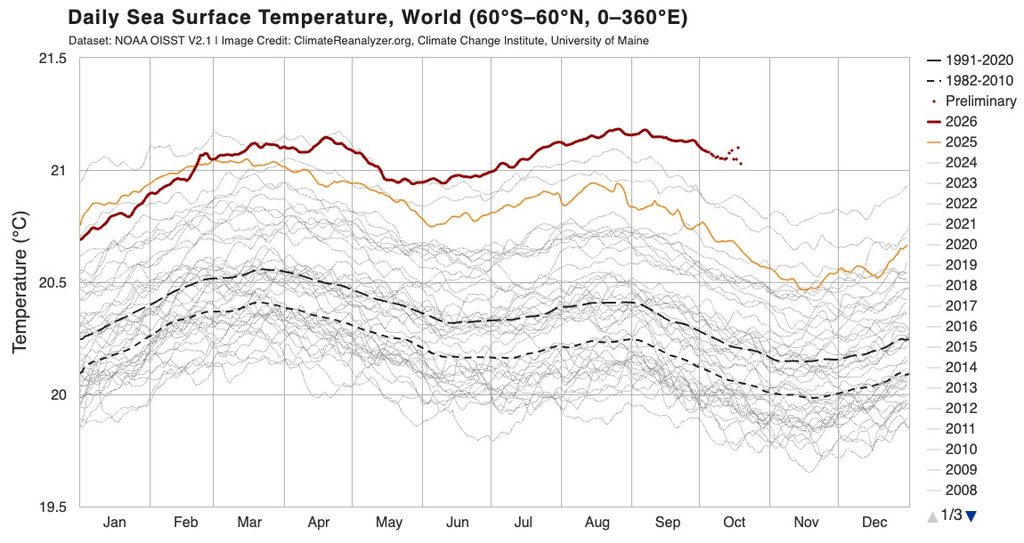
With records being broken it’s not too much of a surprise to see this El Nino event not acting as we might traditionally expect – expect to see more unusual / extreme weather events as we move through the remainder of this year and through 2027…